Browser-Based Audio Metering With the Web Audio API
How to drive your user interface with browser-based audio analysis
The browser has gotten surprisingly good at processing real-time audio FFTs, thanks to the Web Audio API. As a result, incredible dynamic musical interfaces are now very achievable on the modern web, and it’s a heck of a lot easier than most developer resources would have you believe.

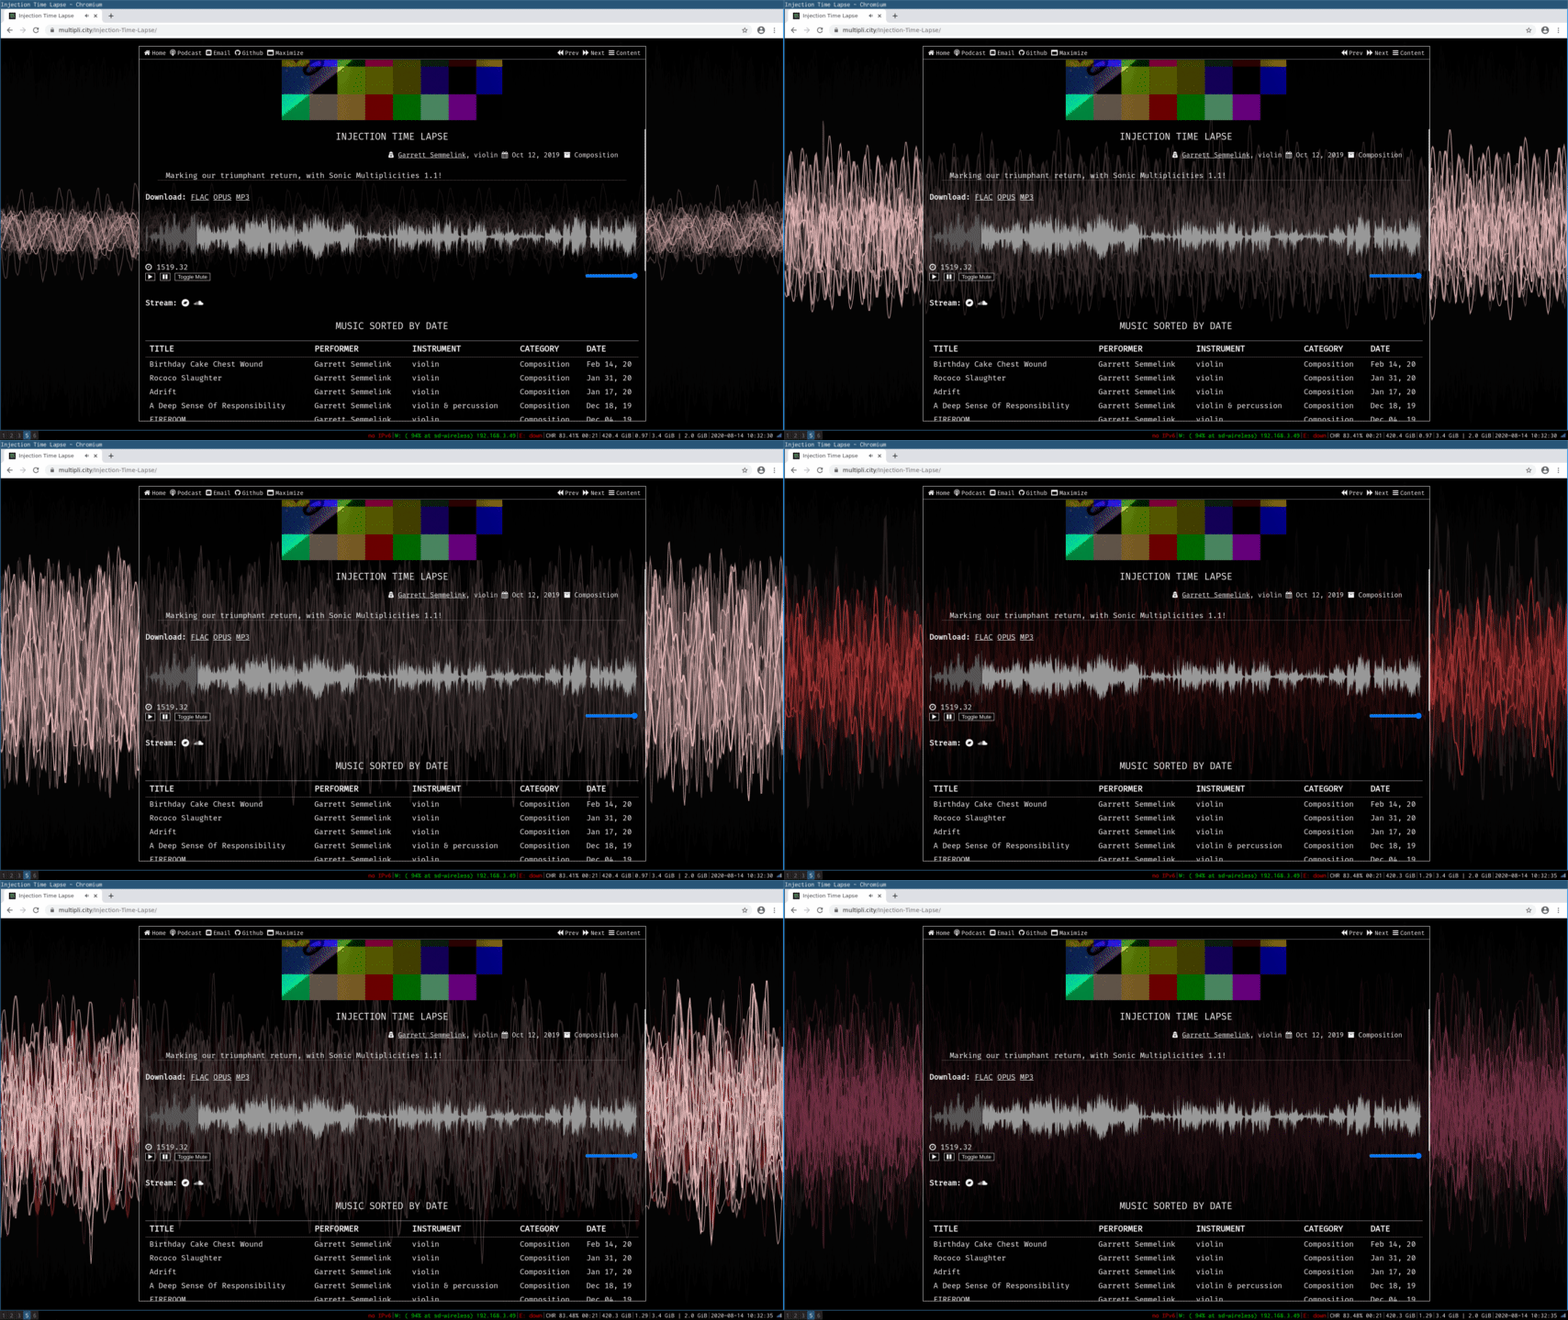
Above is a screengrab from my musical homepage, Multipli.city. There, I host all of my music from over the last ten years for free streaming and lossless download. One of the benefits to listening on the website is the unique visualization experience I offer listeners.
This article will demonstrate how quick, easy, and powerful the Web Audio API can be, by taking you through the code that is needed to generate cool visualizations of your own.
How It’s Done
Building off of some example code from MDN, I leverage the browser’s Web Audio API to instantiate an audio analysis node, which is easily done via JavaScript. Then, I hook it into my JavaScript audio playback library, the wonderfully fantastic Wavesurfer.js.
Setting Up the Analyser
Our analyser is setup via JavaScript:
// Instantiate our web audio playback library, Wavesurfer in this case
var wavesurfer = WaveSurfer.create({
  container: "#player",
  cursorWidth: 2,
})

// Grab the audio context from wavesurfer so we can insert an analysis node
var audioCtx = wavesurfer.backend.ac

// Create the analyser node and give it a buffer size of 2048
// which is a good compromise between performance and resource use
var analyser = audioCtx.createAnalyser()
analyser.fftSize = 2048

// Setup the analyser to perform time domain analysis in real-time
var bufferLength = analyser.frequencyBinCount
var dataArray = new Uint8Array(bufferLength)
analyser.getByteTimeDomainData(dataArray)

// Don't forget to attach the analyser as a Wavesurfer filter
wavesurfer.backend.setFilter(analyser)
Generating the Canvas
In HTML, create a canvas:
<canvas id="c"></canvas>
Then grab that canvas’s context inside your JavaScript:
var canvas = document.getElementById("c")
var canvasCtx = canvas.getContext("2d")
At this point, we should have an audio analyser node and a canvas on which to draw. Now, we just need to create our animations and draw them onto the canvas.
Creating A Groovy Function
We’ll now need to write a function that will draw our audio analysis information onto the canvas, in the form of an oscilloscope.
Our draw() function uses requestAnimationFrame() to tell the browser that we want it to continuously execute for the purposes of rendering an animation (A). We then grab the current time domain data from the audio analyser node established previously (B).
Next, we use our canvasCtx to set the properties for the line we are about to draw on the canvas (C). Once we’ve done this preliminary work, we are ready to work with our analyser’s buffered audio data. We start by looping through the captured audio and determining how high on the Y axis each item in the array ought to be to accurately render audio levels (D). We conclude the execution of our draw() function by making our line on the canvas (E).
function draw() {
  // (A)
  requestAnimationFrame(draw)

  // (B)
  analyser.getByteTimeDomainData(dataArray)

  // (C)
  canvasCtx.fillStyle = `rgb(0, 0, 0, ${alpha})`
  canvasCtx.fillRect(0, 0, canvas.width, canvas.height)
  canvasCtx.lineWidth = lineWidth
  canvasCtx.strokeStyle = "#FFF"
  canvasCtx.beginPath()
  var sliceWidth = canvas.width * 1.0 / bufferLength

  // (D)
  var x = 0
  for (var i = 0 i < bufferLength i++) {
    var v = dataArray[i] / 128.0
    var y = v * canvas.height / 2
    if (i === 0) {
      canvasCtx.moveTo(x, y)
      if (lineWidth > 5) {
        drawColors = shuffle(drawColors)
      }
    } else {
      canvasCtx.lineTo(x, y)

      if (lineWidth > 0) {
        lineWidth += (linewidth / y)
      } else {
        lineWidth = 2
      }
    }

    x += sliceWidth
  }

  // (E)
  canvasCtx.lineTo(canvas.width, canvas.height / 2)
  canvasCtx.stroke()
}
Instead of an oscilloscope design, you could also try a frequency graph like the one MDN outlines here.
Some Best Practices
When using requestAnimationFrame() it is wise to capture its return value to a new variable, such as animationId:
var animationId = requestAnimationFrame(draw)
Doing this will allow you to use the cancelAnimationFrame() method on the window when you want to kill the animation:
wavesurfer.on('finish', () => {
  if (animationid) {
    cancelAnimationFrame(animationId)
    animationId = undefined
  }
})
Resources
Check out my public code on GitHub for examples of where to take your new freaky audio visualizations!
Live examples of this work are available at https://multipli.city